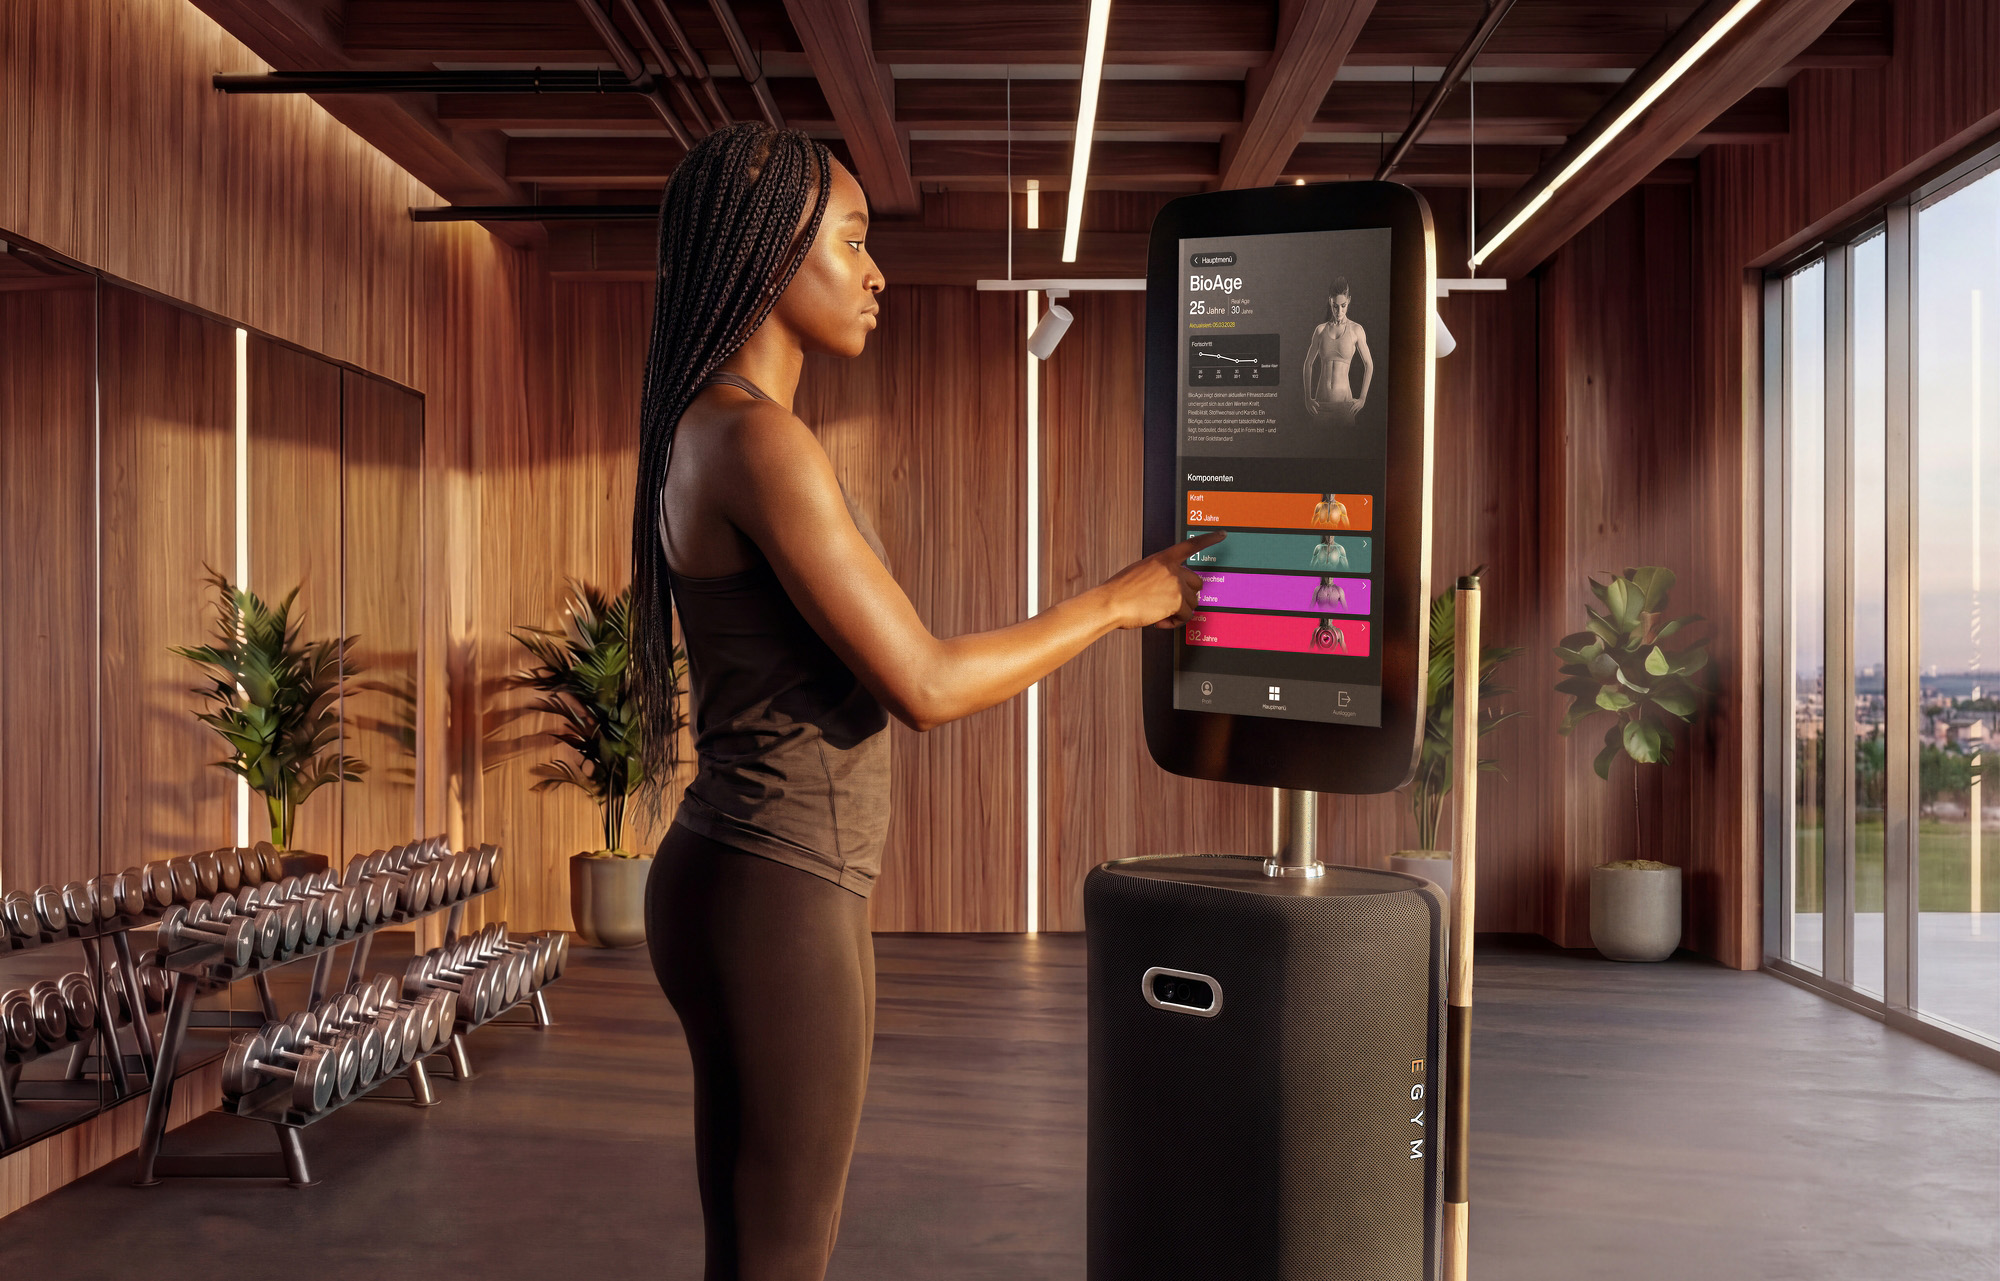
To make it easier for members to understand how their training is having a positive impact on their individual fitness and health, it is crucial to make progress visible. Because seeing progress makes it easier to stay motivated. The EGYM BioAge is a comprehensive fitness and health indicator that takes into account a variety of user measurements. This is used to calculate the BioAge, which is easy to interpret in relation to a member’s actual age.
Why does BioAge exist at all?
Our motivation is to use today’s possibilities of digitalization and technology to make training in the gym successful for everyone (“Make the Gym work for Everyone”).
Everyone knows that physical exercise has a positive effect on health. However, it is more difficult to make the exact extent of this effect measurable and easy to understand. The biggest challenge in our industry is to support members with the following questions: How can I motivate myself to exercise regularly? What is my current state of health, what was it like some time ago? What is the best way for me to get fit? How can I see the positive effects on my health and know that I am on the right track?
These are precisely the reasons why we designed the EGYM BioAge. In short, the BioAge exists to:
- To enable a well thought-out and scientifically sound assessment of the state of health
- To enable structured and targeted individual training advice
- To enable mass market customers to understand and visualize the positive effects of training on their own health
Other elements of our approach are complementary to EGYM BioAge, as a comprehensive health and fitness indicator. For example, our activity points and activity levels help to reward members for being active, even before changes in health and fitness are measurable, and to develop the healthy habit of exercising regularly.
You are currently viewing a placeholder content from YouTube. To access the actual content, click the button below. Please note that doing so will share data with third-party providers.
More InformationWhat is behind BioAge?
To calculate the BioAge, EGYM uses a sophisticated analysis of various scientifically proven factors that are directly related to physical performance, health and the status of the immune system – in other words, it represents a holistic approach . Thanks to the unique, large pool of data that we at EGYM can draw on as a reference, the EGYM BioAge offers a very reliable benchmark calculation with millions of data points collected over many years. This also makes it possible to continually optimize the calculation and make it even more precise. All this, of course, with the aim of helping trainers and members to achieve fitness and health goals together.
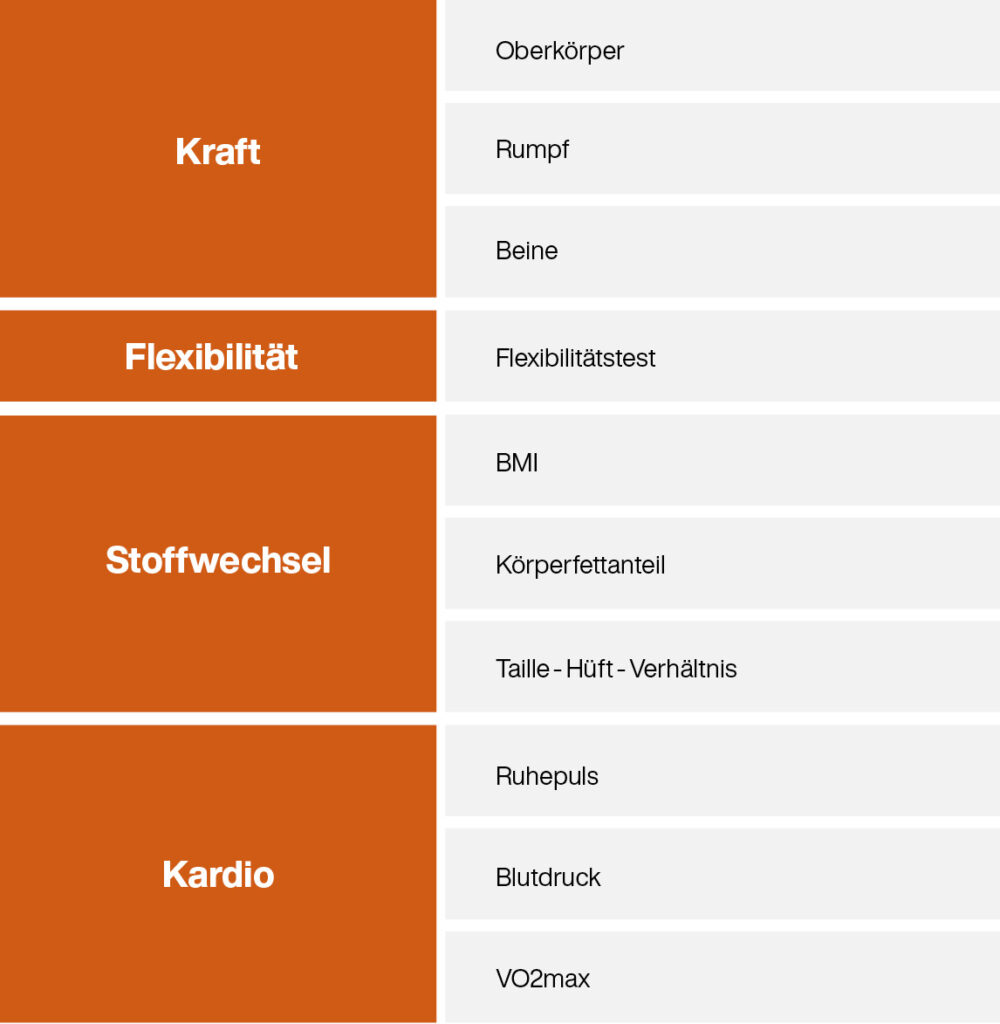
The EGYM BioAge combines a variety of measured values and health parameters, which are divided into four areas:
- Power
- Flexibility
- Metabolism
- Cardio
How is the value of BioAge calculated?
The biological age shows where exercisers stand in comparison to typical average values for their real age. For the “Strength” value, for example, the maximum strength performance achieved on EGYM Smart Strength machines is compared with the available data for different age groups. Flexibility can finally be reliably measured thanks to the EGYM Fitness Hub. The values for “Cardio” and “Metabolism” can be measured using compatible partner devices.
This can also be described as follows: If, for example, a 50-year-old achieves a performance that corresponds to the average of all 45-year-old users, this results in a younger biological age – 45 years. Conversely, of course, the same applies: a poorly trained 30-year-old who only achieves the average maximum strength performance of all 40-year-olds in comparison is already biologically 40 years old.
How do the BioAge parameters relate to health?
The “force” value
The “Force” value sets the user’s body weight in relation to their strength.
Strength is the foundation of a person’s ability to perform mechanical tasks, exert forces and moments. A loss of muscle mass and strength can cause various metabolic and cardiovascular problems, such as a decrease in bone density, fat gain and diabetes (Westcott, 2012). In addition, the effect of sarcopenia (loss of muscle mass and strength) is a common problem in modern populations that can be effectively delayed by resistance training (Morley et al., 2011). Strong muscles also act as a hormonally active organ that produces protective myokines that rejuvenate the immune system (Nieman and Wentz, 2019).
The “metabolism” value
The “metabolism” value provides further insight into the state of health by relating weight, fat and height. It is calculated by body mass index (BMI), body composition and waist-to-hip ratio. BMI is a widely used, easy-to-calculate health indicator, but should not be considered in isolation. Therefore, EGYM BioAge goes further. A good metabolic status is also an indicator of a well-functioning immune system (de Heredia et al., 2003). Combined with the body fat percentage and the waist-to-hip ratio, it significantly indicates the prediction level for the user’s metabolism.
- The body fat percentage is the ratio of body fat to total body mass. A body fat percentage within the normal range is a major factor in the prevention of metabolic syndrome (Zhu et al., 2003). It is also associated with reducing the risk of cardiovascular disease and lowering the risk of cancer (Britton et al., 2013 and De Koning, 2007).
- The waist-to-hip ratio as an estimate of abdominal fat distribution is associated with cardiovascular diseases and events (De Koning et. al., 2007). An even better prediction can be made if the measurement results can be combined with the BMI measurement, as with the EGYM BioAge (WHO, 2011). The waist-to-hip ratio is calculated by dividing the waist circumference by the hip circumference.
- A BMI value within the suggested normal range is associated with reduced risk factors for cardiovascular disease, diabetes, hypertension, dyslipidemia and all-cause mortality (U.S. Department of Health and Human Services, 2013). BMI is defined as a person’s weight in kilograms divided by the square of their height in meters (kg/m²).
The “Cardio” value
The “cardio“(cardiovascular) value combines the resting heart rate, blood pressure and VO2max. It provides an overview of cardiovascular capacity, performance and health. A strong cardiovascular system is also associated with a strong immune system (Kullo et al., 2007). These methods are commonly used in medical practice to determine health status.
- VO2max is considered the most accurate measure of cardiovascular fitness and is often used to assess the status of athletes. A higher VO2max is associated with a greater ability of the body to transfer and consume oxygen (Hawley, 1992).
- High blood pressure can be an indicator of underlying diseases and can have long-term effects such as heart attack, stroke and kidney failure. (Williams, 2018; Frese, 2011).
- A low resting heart rate is a good indicator of cardiovascular fitness (Silva, 2018). Therefore, lower values predict a reduced risk of coronary heart disease, myocardial events and overall mortality from cardiovascular disease (Fox et al., 2007).
The “flexibility” value
The “Flexibility” value corresponds to the general mobility of a user compared to their age group. It contains a detailed overview of the flexibility of certain muscle groups. This overview also shows whether there are any imbalances in a user’s flexibility. The user can view the raw angles with Fitness Hub or partner devices of all flexibility tests performed, including progress since the last measurement time. It also shows whether the current value is good, average or worse compared to a normalized value for the user’s age. Additional information about the health effects and context of the mobility tests is displayed on the screen. This includes specific training recommendations to improve mobility based on the individual results. There is also a direct link to our Smart Flex machines. The training sessions on the Smart Flex machines can help to improve overall flexibility through guided muscle length training.
- It has been widely proven: Flexibility decreases with age. Between the ages of 30 and 70, flexibility decreases by 20-30% (Adams et al., 1999). This has been demonstrated not only for overall mobility, but also for specific joints that show a decrease in range of motion, e.g. neck flexion (Lind et al., 1989; Youdas et al., 1992) or trunk lateral flexion (Fitzgerald et al., 1983)
- Flexibility is crucial, both for daily life and athletic performance. It helps a “person to cope with the functional demands of life and enhances the person’s ability to participate in leisure activities.” (Adams et al. 1999). Conversely, “a lack of flexibility can increase injury rates and cause functional problems, especially in those who are sedentary and in middle-aged and older individuals” (Adams et al. 1999).
- The causes or underlying mechanisms for the loss of freedom of movement are the loss of sarcomeres, not only in parallel but also in series (Narici et al., 2003)
The current method of calculating the flexibility score is based on current scientific literature, EGYM’s internal tests and our beta tests with test customers. Over time, however, we expect to build up the world’s largest database for flexibility, which will enable us to continuously expand the validity of the flexibility value and its relationship to age and further optimize its usability.
Fitness Hub makes flexibility measurable and progress visible – with flexibility tests and the BioAge directly on the training area!
Literature & Sources
Adams, K., O’Shea, P., & O’Shea, K. L. (1999). Aging: its effects on strength, power, flexibility, and bone density. Strength and conditioning Journal, 21, 65-77.
Britton, K.A.; Massaro, J.M.; Murabito, J.M.; Kreger, B.E.; Hoffmann, U.; Fox, C.S. (2013). Body fat distribution, incident cardiovascular disease, cancer, and all-cause mortality. Journal of the American College of Cardiology 62(10): 921-925.
De Koning, L., Merchant, A. T., Pogue, J., & Anand, S. S. (2007). Waist circumference and waist-to-hip ratio as predictors of cardiovascular events: meta-regression analysis of prospective studies. European heart journal, 28(7), 850-856.
Fitzgerald, G. K., Wynveen, K. J., Rheault, W., & Rothschild, B. (1983). Objective assessment with establishment of normal values for lumbar spinal range of motion. Physical therapy, 63(11), 1776-1781.
Fox, K., Borer, J. S., Camm, A. J., Danchin, N., Ferrari, R., Sendon, J. L. L., … & Heart Rate Working Group. (, 2007). Resting heart rate in cardiovascular disease. Journal of the American College of Cardiology, 50(9), 823-830.
Frese, E. M., Fick, A., & Sadowsky, H. S. (2011). Blood pressure measurement guidelines for physical therapists. Cardiopulmonary physical therapy journal, 22(2), 5.
Hawley, J.A., and Noakes, T.D. (, 1992). Peak power output predicts maximal oxygen uptake and performance time in trained cyclists. European Journal of Applied Physiology, 65: 79-83.
de Heredia, F.P.; Gómez-Martínez, S.; Marcos A. (2003). Obesity, inflammation, and the immune system. Proceedings of the Nutrition Society. 71(2): 332-338
Kullo I.J.; Khalegh, M.; Hensrud, D.D. (2007). Markers of inflammation are inversely associated with V̇o2 max in asymptomatic men. Journal of Applied Physiology. 102(4): 1374-1379
Lind, B., Sihlbom, H., Nordwall, A., & Malchau, H. (1989). Normal range of motion of the cervical spine. Archives of physical medicine and rehabilitation, 70(9), 692-695.
Morley, J. E., Baumgartner, R. N., Roubenoff, R., Mayer, J., & Nair, K. S. (2001). Sarcopenia. Journal of Laboratory and Clinical Medicine, 137(4), 231-243.
Narici, M. V., Maganaris, C. N., Reeves, N. D., & Capodaglio, P. (2003). Effect of aging on human muscle architecture. Journal of applied physiology, 95(6), 2229-2234.
Nieman DC, Wentz LM. 2019. The compelling link between physical activity and the body’s defense system. Journal of Sport and Health Science. 8(3): 201-217.
Silva, D. A. S., Lima, T. R. D., & Tremblay, M. S. (2018). Association between resting heart rate and health-related physical fitness in Brazilian adolescents. BioMed research international, 2018.
Westcott, W. L. (2012). Resistance training is medicine: effects of strength training on health. Current sports medicine reports, 11(4), 209-216.
Youdas, J. W., Garrett, T. R., Suman, V. J., Bogard, C. L., Hallman, H. O., & Carey, J. R. (1992). Normal range of motion of the cervical spine: an initial goniometric study. Physical therapy, 72(11), 770-780.
World Health Organization. (, 2011). Waist circumference and waist-hip ratio: report of a WHO expert consultation, Geneva, December 8-11, 2008.
Zhu, S.; Wang, Z., Shen, W.; Heymsfield, S.B.; Heshka, S. (2003). Percentage of body fat ranges associated with metabolic syndrome risk: results based on the third National Health and Nutrition Examination Survey (1988-1994). The American Journal of Clinical Nutrition. 78(2): 228-235
This article was researched using AI and edited by our editorial team.